On Friday, new coronavirus infections rose again to a record level in Germany, with more than 7,300 cases reported within 24 hours.
Meanwhile, the list of coronavirus risk areas within Germany continues to grow. As of Friday morning there were over 60 cities and districts with more than 50 infections per 100,000 residents in seven days (the full list is below).
In North Rhine-Westphalia alone, 19 cities are now considered hotspots. The Ruhr area is particularly hard hit.
According to the Robert Koch Institute (RKI), cities such as Dortmund and Bochum have now also exceeded the critical threshold of 50 new infections per 100,000 residents in seven days.
READ ALSO: Germany reports new coronavirus case record as fear of infections grows
Berlin, Cologne and Frankfurt and Bremen are also well above this threshold. Earlier this week, Thuringia reported its first hotspot within the district of Eichsfeld.
On Wednesday, Chancellor Angela Merkel and the leaders of the 16 federal states thrashed out new measures that will affect places with high coronavirus rates.
Some changes come into force when an area registers 35 Covid-19 infections per 100,000 people within seven days. The restrictions get tougher as the number of infections grow.
READ ALSO: What you need to know about Germany's new coronavirus measures for autumn
The Association of Towns and Municipalities has warned that there will be a large increase in coronavirus risk areas in Germany. It can't be ruled out that soon every large city will become a risk area, said chief executive Gerd Landsberg to German broadcaster ZDF.
When is an area classed as a 'risk zone'?
If a district or city passes the level of 50 cases per 100,000 inhabitants in the last seven days, it is declared a risk zone.
People living in this areas face more stringent measures and restrictions such as aban on staying overnight in accommodation in other parts of Germany.
However, as Germany is a federal country, there may be local differences to rules or processes.
The below map by DPA shows some of the hotspot areas (coloured in red) plus the areas with more than 35 infections per 100,000 residents in seven days (coloured in pink).
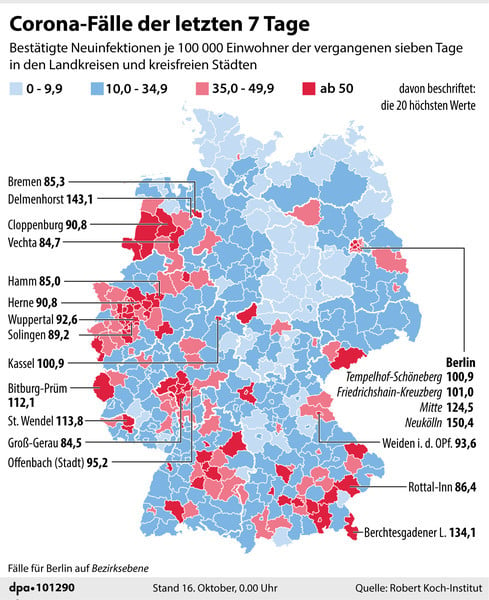
Here's a list of the coronavirus hotspots in Germany (data from the Robert Koch Institute, as of October 16th):
Coronavirus risk areas in Baden-Württemberg:
City/district plus new infections per 100,000 inhabitants in the last 7 days
District of Esslingen 82.4
Stuttgart 82.9
Baden-Baden city district 52.6
Ludwigsburg County 51.2
Heilbronn city district 58.5
Schwäbisch Hall County 51.3
Black Forest-Baar-District 56.0
Mannheim 56.7
Tübingen 63.4
Coronavirus risk area in Bavaria:
Ebersberg 58.5
Rosenheim County 57.4
Regen County 68.5
Munich 57.7
Neuburg-Schrobenhausen 63.7
District of Rottal-Inn 86.4
Mühldorf an der Inn County 68.2
Wieden in der Oberpfalz 93.6
Schweinfurt County 65.8
Berchtesgadener Land 134.1
Augsburg 55.3
Coronavirus risk areas in Berlin:
Berlin 73.85
Break down of districts:
Berlin Neukölln 150.4
Berlin Mitte 124.5
Berlin Friedrichshain-Kreuzberg 101
Berlin Tempelhof-Schöneberg 100.9
Berlin Charlottenburg-Wilmersdorf 64.6
Berlin Spandau 50.2
Berlin Reinickendorf 76.6
Coronavirus risk area in Bremen:
City of Bremen* 85.3
*The city of Bremerhaven, which belongs to the federal state of Bremen, continues to be below the critical mark and has not tightened measures. Nevertheless, in some states the city is classified as a risk area because the port in Bremerhaven belongs to the city of Bremen and therefore in some databases the entire postcode area is considered a risk area.
Coronavirus risk area in Saarland:
St. Wendel 113.8
Neunkirchen 84.5
Coronavirus risk areas in Rhineland-Palatinate
Eifel district Bitburg-Prüm rural district 112.1
Mainz 65.4
Coronavirus risk areas in Thuringia
Eichsfeld 73.0
Coronavirus risk areas in Hesse:
Frankfurt am Main 75.2
Groß-Gerau County 84.5
Main-Taunus county 61.6
Offenbach am Main 95.2
Rheingau-Taunus district 56.6
Wiesbaden 53.1
High Taunus 52.8
Kassel 100.9
Coronavirus risk areas in Lower Saxony:
County of Cloppenburg 90.8
Delmenhorst 143.1
District of Vechta 84.7
County of Emsland 64.8
County of Bentheim 72.2
Coronavirus risk areas in North Rhine-Westphalia:
Leverkusen 62.9
Hagen 53.5
Hamm 85.0
Herne 90.8
Cologne 75.4
District of Recklinghausen 76.9
Duisburg 72.2
Solingen 89.2
Wuppertal 92.6
Mettmann 70.2
Düsseldorf 59.3
Olpe 54.5
Essen 54.6
Unna 67.4
Dortmund 58.8
Bochum 55.3
Gelsenkirchen 78.6
Mühlheim an der Ruhr 68.0
Aachen urban region district 68.6
Bielefeld 51.5
Remscheid 51.2
Coronavirus risk areas in Saxony:
Erzgebirgskreis 60.3
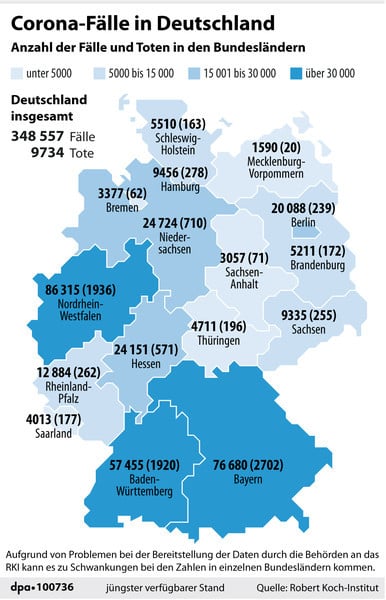
The map by DPA below shows the total number of coronavirus infections registered in Germany (348,557) and the number of deaths (9,734). Plus these figures state by state:
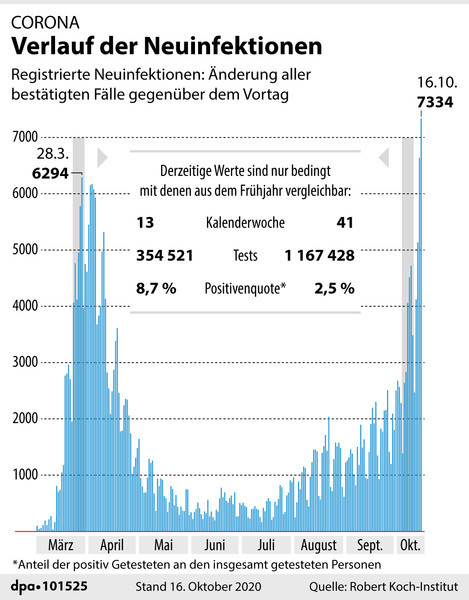
The following graphic by DPA breaks down the total number of new infections across Germany per day since March 28th up until October 16th.
The resurgence is clear to see. However it also shows the increase in the number of tests being carried out. In calendar week 13 (week beginning March 23rd), 354,521 tests were carried out with a positive rate of 8.7 percent. In calendar week 41 (week beginning October 5th), 1,167,428 tests were done with a 2.5 percent positive rate.
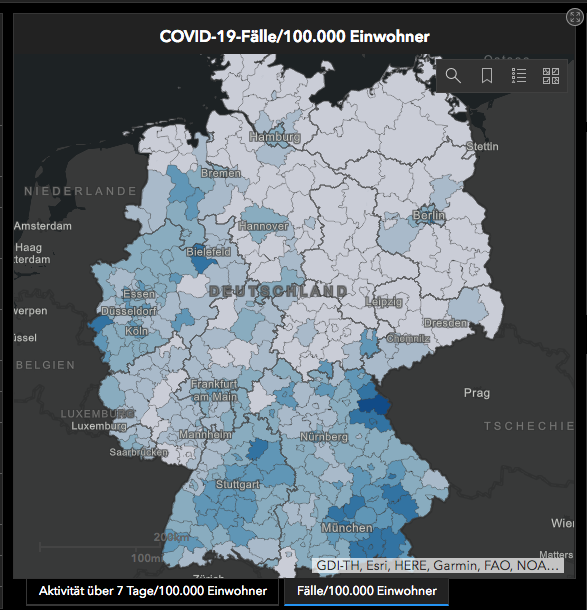
The following map by the Robert Koch Institute shows the overall number of infections per 100,000 people. It's clear areas in Bavaria and North Rhine-Westphalia have highest infection rates.
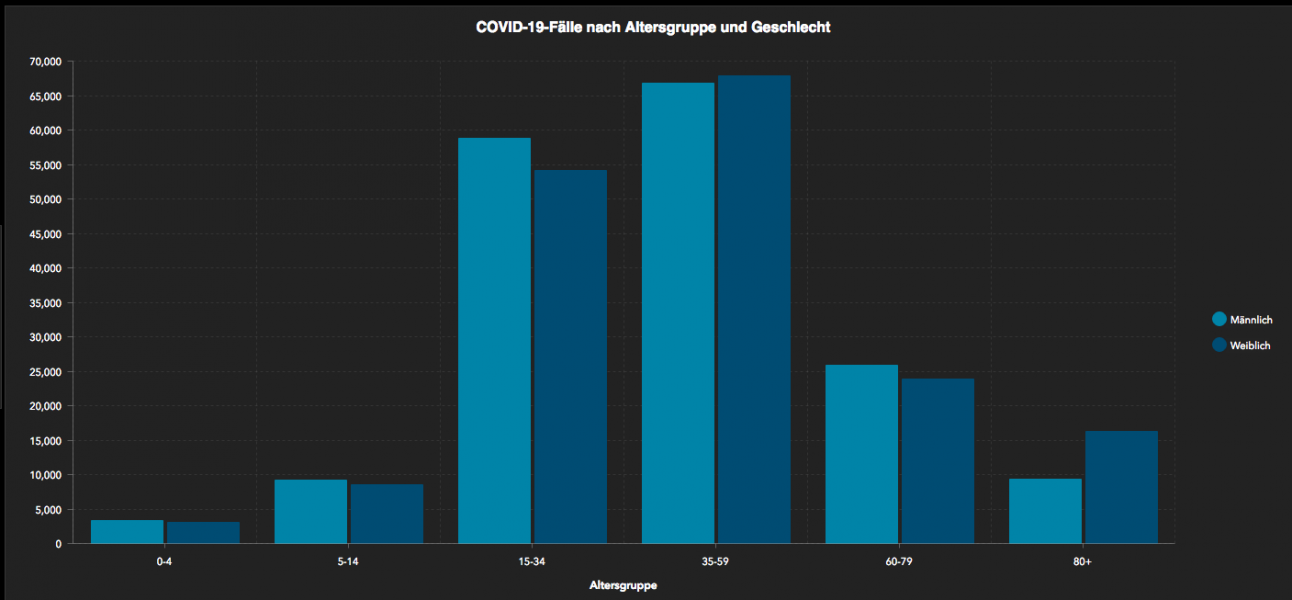
The below graph by the Robert Koch Institute shows confirmed Covid-19 cases in Germany by age group and gender. Men are the left, lighter blue column, and women are the darker blue column on the right.
The age groups with the highest infection rates are 35-59 year olds, followed by 15-34 year olds.
Comments