One year on: The charts and maps that explain the state of the pandemic in Germany

As Chancellor Angela Merkel reverses her decision to introduce tougher lockdown measures over Easter to halt the spread of Covid-19, we explain the current state of the pandemic.
The overall state of play
Over 75,000 people have now died from or with Covid-19 since the start of the pandemic in Germany a little over a year ago, according to the latest figures from the Robert Koch Institute on Wednesday.
And, over the past couple of weeks, case numbers have been rising more rapidly, largely due to the new, more contagious Covid-19 variants in circulation.
We can see this trend in the below chart, which shows that the number of cases per million people leapt to 163.97 as of March 23rd, from 99.84 two weeks earlier.
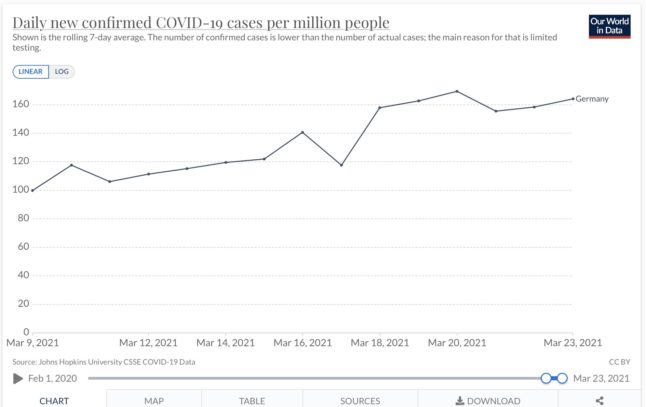
There have been a total of 2,690,523 Covid-19 cases since the pandemic began (up to March 24th 2021).
On Tuesday, Chancellor Angela Merkel introduced a strict lockdown over Easter in a bid to curb the spread of the virus, but in a sharp about-turn on Wednesday, she reversed her earlier decision amid widespread criticism.
To date, Germany’s most populous state, North Rhine-Westphalia, has recorded the most infections, followed by Bavaria, Germany's largest state in terms of area.
However, the current incidence rate is by far the highest in Thuringia, followed by two other eastern German states: Saxony and Saxony-Anhalt.
Number of deaths
The total number of deaths in Germany as of March 24th 2021 is 75,212, according to data from the Robert Koch Institute (RKI) on Wednesday.
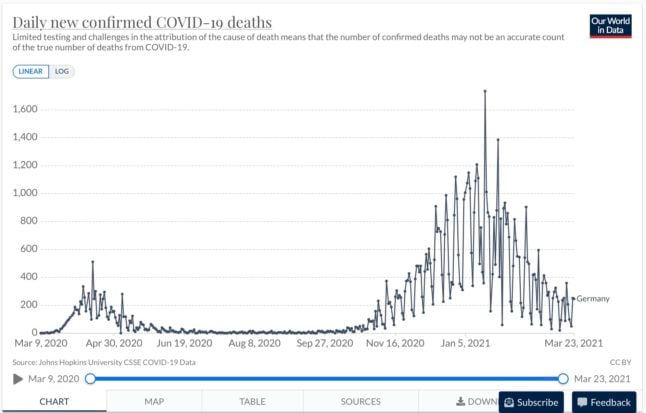
However, there is some good news: far fewer people are dying than in January. On Tuesday, 250 new Covid-19 deaths were reported to the RKI, well below the record high of 1,244 seen on January 14th.
The below chart from Our World In Data based on information from Johns Hopkins University shows the number of daily new deaths linked to Covid-19 in Germany since the pandemic began.
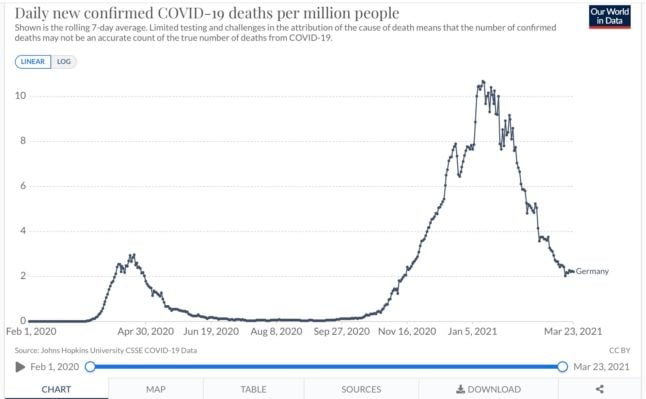
And this graph (below) shows the daily new confirmed deaths per million people, clearly showing how much deadlier the second wave of the pandemic has been than the first.
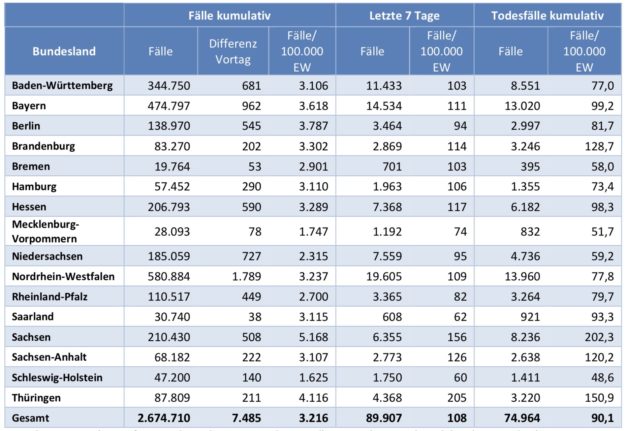
At a state level, North Rhine-Westphalia and Bavaria have registered the most deaths and have the largest number of cases.
Cumulative cases, cases over the last seven days and cumulative deaths for each of the states can be seen in the below table from the RKI.
New cases
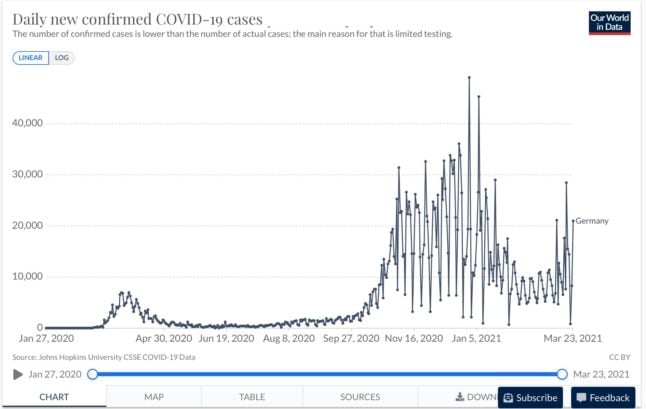
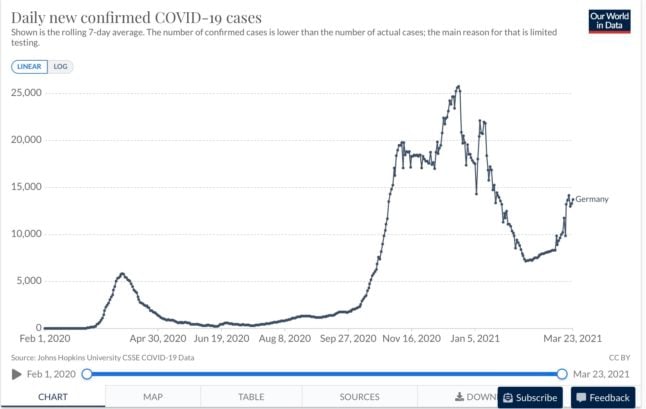
On March 24th, Germany reported 7,485 new confirmed coronavirus cases, well below the peaks seen in January.
The number of confirmed cases is lower than the actual number of cases as, although testing has increased since the start of the pandemic, it is still limited.
We can see from the below charts that while cases are still far off the highs registered in January, numbers are creeping up again, supporting concerns of a third wave of the pandemic and leading to a lockdown extension until April 18th.
READ ALSO: 'Third wave has already begun': Germany records sharp increase in Covid-19 cases
The charts below show daily new confirmed cases, and the seven-day average, respectively.
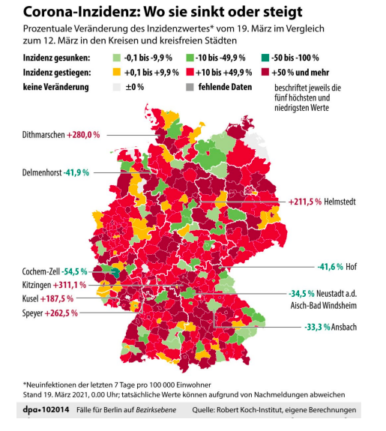
Coronavirus cases in the last seven days per 100,000 residents
The DPA map below shows the percentage change in the virus incidence rate over the past week until March 19th, giving a clear picture of which states are seeing Covid-19 infections go up or down.
Yellow and shades of red indicate areas where the incidence rate is increasing, with the deepest red representing the worst-hit areas, while shades of green depict places where the pandemic is receding, with the lightest colour representing those states with the lowest rates.
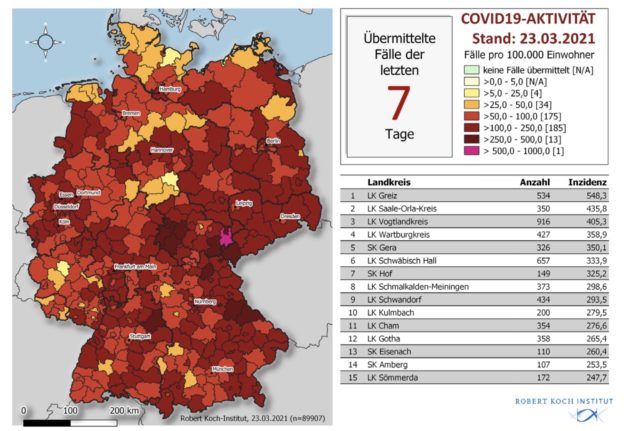
This map (below) from the RKI shows a similar picture, up to March 23rd. The area in pink is the worst-affected in terms of cases per 100,000 residents reported for the seven days until March 23rd.
And this RKI line graph (below) shows the number of reported cases per 100,000 residents over the last seven days by state. The greyed-out section shows where numbers are likely to increase as further cases are reported retrospectively.
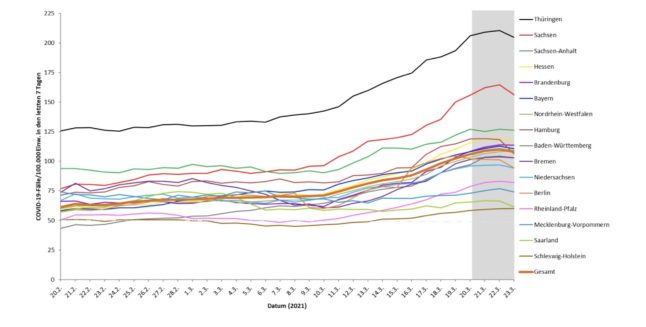
The graph clearly demonstrates that the seven-day incidence rate in Thuringia is significantly higher than the national average.
New cases based on age group
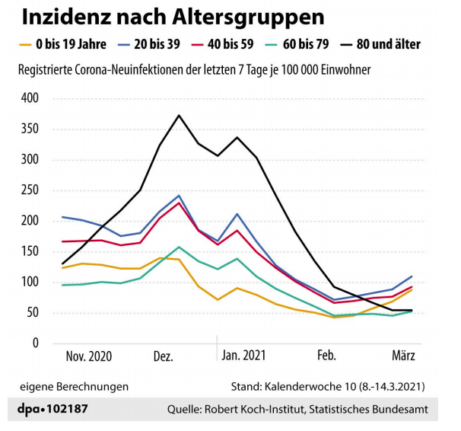
The chart below shows new Covid-19 infections per 100,000 residents for the last seven days according to age group.
All cases have fallen from the highs seen in December and January, but the drop is particularly marked in the 80 and over group, indicating that we may be starting to see the effects of the vaccination programme.
READ ALSO: When will I be in line for a Covid-19 vaccination in Germany?
But while that group is now plateauing, other age groups are seeing case rates increase again.
Testing
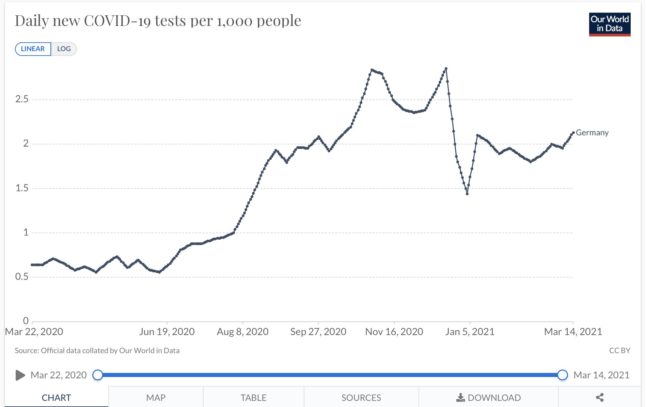
The chart below gives a snapshot of the number of tests carried out per 1,000 people in Germany since the pandemic began.
On March 13th – the latest available data – Germany carried out 2.10 tests per 1,000 people.
However, while this is well above figures seen at the start of the pandemic (0.62 per 1,000 people on April 26th 2020), it has fallen from the high of 2.81 per 1,000 people seen on December 19th 2020 as people rushed to get themselves tested before Christmas so they could more safely see relatives.
Vaccination
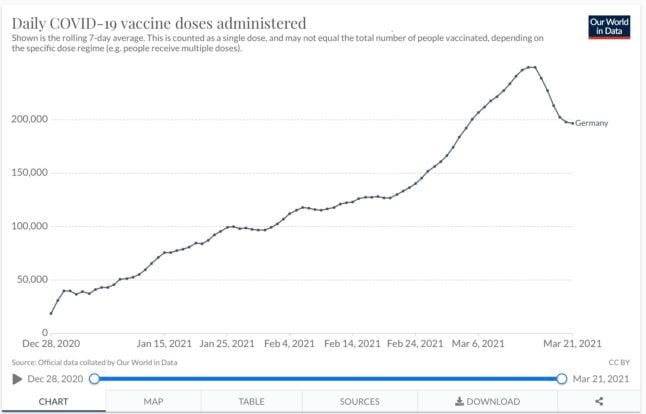
As of March 24th, the number of people who had had their first jab stood at 9.3 percent of the population, or 7,698,450, according to the RKI.
4.1 percent of the population, or 3,415,612 people, have had their second dose.
Like most other European countries, the vaccination rollout in Germany has been hampered by the European Union’s collective buying programme, as well as issues with the AstraZeneca vaccine. The recent drop in March coincides with the now-reversed decision to suspend the use of Oxford-Swedish vaccine amid side-effects concerns.
READ ALSO: Why have tens of thousands of Germany's AstraZeneca vaccines not been used?
The chart below shows the rolling seven-day average of the number of vaccination doses administered in Germany since the vaccination programme started in December 2020.
How strict has Germany been?
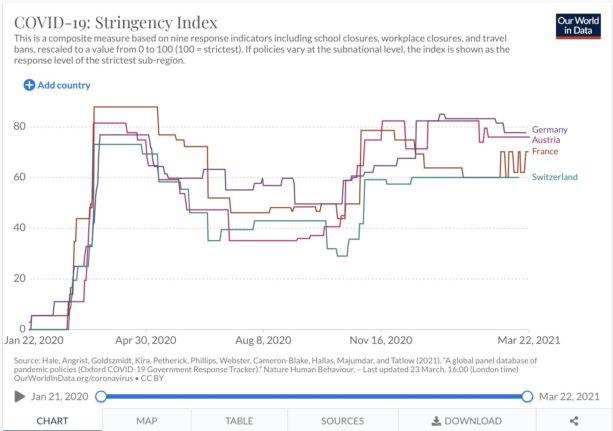
The chart below gives an idea of how strict the German government has been in introducing measures to stem the spread of the virus.
It shows how the governmental response has changed over time and also indicates a measure called the Government Stringency Index. This is a composite measure of the strictness of policy responses.
On any given day, this index is calculated as the mean score of nine policy measures, each taking a value between 0 and 100, where 100 is the strictest.
The nine metrics used to calculate the Government Stringency Index are: school closures, workplace closures, cancellation of public events, restrictions on public gatherings, closures of public transport, stay-at-home requirements, public information campaigns, restrictions on internal movements, and international travel controls.
In the below chart you can see the German government reaction compared to that of neighbours France, Austria and Switzerland.
What’s the situation in hospitals?
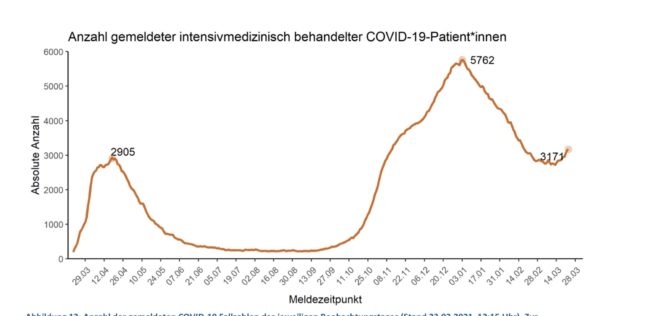
According to DIVI, Germany’s intensive care availability register, the number of Covid-19 patients needing intensive care currently stands at 3,209, a day-on-day increase of 38. A full 54 percent of these patients are on invasive mechanical ventilation.
This is up from 2,736 patients from two weeks earlier (March 10th), signalling that pressure is increasing on German hospitals.
As of March 24th, a total of 20,713 intensive care beds (low- and high-care) are occupied and 3,411 beds are currently available.
READ ALSO: 'Chronic overwork of staff': Germany sees spike in Covid-19 intensive care patients
The below graph from the RKI shows how the number of Covid-19 patients being treated in intensive care has changed since the start of the pandemic.
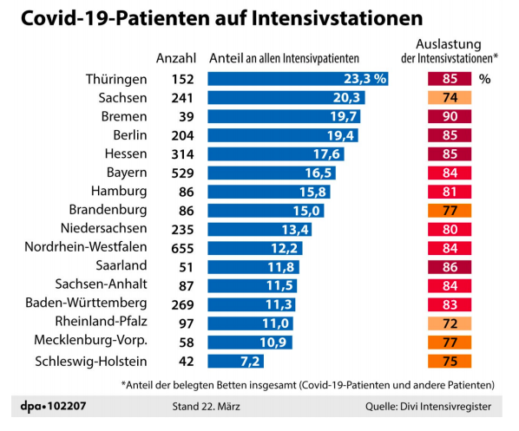
And this table from DPA (below) shows the number of patients in intensive care per state, each state's percentage of Germany's total intensive care patients and how full each state's ICU's are. As you can see, intensive care units in Thuringia are at 85 percent of their total capacity.
To view more charts, maps and graphs on Germany’s Covid-19 situation, you can visit Our World in Data.
Comments
See Also
The overall state of play
Over 75,000 people have now died from or with Covid-19 since the start of the pandemic in Germany a little over a year ago, according to the latest figures from the Robert Koch Institute on Wednesday.
And, over the past couple of weeks, case numbers have been rising more rapidly, largely due to the new, more contagious Covid-19 variants in circulation.
We can see this trend in the below chart, which shows that the number of cases per million people leapt to 163.97 as of March 23rd, from 99.84 two weeks earlier.
There have been a total of 2,690,523 Covid-19 cases since the pandemic began (up to March 24th 2021).
On Tuesday, Chancellor Angela Merkel introduced a strict lockdown over Easter in a bid to curb the spread of the virus, but in a sharp about-turn on Wednesday, she reversed her earlier decision amid widespread criticism.
To date, Germany’s most populous state, North Rhine-Westphalia, has recorded the most infections, followed by Bavaria, Germany's largest state in terms of area.
However, the current incidence rate is by far the highest in Thuringia, followed by two other eastern German states: Saxony and Saxony-Anhalt.
Number of deaths
The total number of deaths in Germany as of March 24th 2021 is 75,212, according to data from the Robert Koch Institute (RKI) on Wednesday.
However, there is some good news: far fewer people are dying than in January. On Tuesday, 250 new Covid-19 deaths were reported to the RKI, well below the record high of 1,244 seen on January 14th.
The below chart from Our World In Data based on information from Johns Hopkins University shows the number of daily new deaths linked to Covid-19 in Germany since the pandemic began.
And this graph (below) shows the daily new confirmed deaths per million people, clearly showing how much deadlier the second wave of the pandemic has been than the first.
At a state level, North Rhine-Westphalia and Bavaria have registered the most deaths and have the largest number of cases.
Cumulative cases, cases over the last seven days and cumulative deaths for each of the states can be seen in the below table from the RKI.
New cases
On March 24th, Germany reported 7,485 new confirmed coronavirus cases, well below the peaks seen in January.
The number of confirmed cases is lower than the actual number of cases as, although testing has increased since the start of the pandemic, it is still limited.
We can see from the below charts that while cases are still far off the highs registered in January, numbers are creeping up again, supporting concerns of a third wave of the pandemic and leading to a lockdown extension until April 18th.
READ ALSO: 'Third wave has already begun': Germany records sharp increase in Covid-19 cases
The charts below show daily new confirmed cases, and the seven-day average, respectively.
Coronavirus cases in the last seven days per 100,000 residents
The DPA map below shows the percentage change in the virus incidence rate over the past week until March 19th, giving a clear picture of which states are seeing Covid-19 infections go up or down.
Yellow and shades of red indicate areas where the incidence rate is increasing, with the deepest red representing the worst-hit areas, while shades of green depict places where the pandemic is receding, with the lightest colour representing those states with the lowest rates.
This map (below) from the RKI shows a similar picture, up to March 23rd. The area in pink is the worst-affected in terms of cases per 100,000 residents reported for the seven days until March 23rd.
And this RKI line graph (below) shows the number of reported cases per 100,000 residents over the last seven days by state. The greyed-out section shows where numbers are likely to increase as further cases are reported retrospectively.
The graph clearly demonstrates that the seven-day incidence rate in Thuringia is significantly higher than the national average.
New cases based on age group
The chart below shows new Covid-19 infections per 100,000 residents for the last seven days according to age group.
All cases have fallen from the highs seen in December and January, but the drop is particularly marked in the 80 and over group, indicating that we may be starting to see the effects of the vaccination programme.
READ ALSO: When will I be in line for a Covid-19 vaccination in Germany?
But while that group is now plateauing, other age groups are seeing case rates increase again.
Testing
The chart below gives a snapshot of the number of tests carried out per 1,000 people in Germany since the pandemic began.
On March 13th – the latest available data – Germany carried out 2.10 tests per 1,000 people.
However, while this is well above figures seen at the start of the pandemic (0.62 per 1,000 people on April 26th 2020), it has fallen from the high of 2.81 per 1,000 people seen on December 19th 2020 as people rushed to get themselves tested before Christmas so they could more safely see relatives.
Vaccination
As of March 24th, the number of people who had had their first jab stood at 9.3 percent of the population, or 7,698,450, according to the RKI.
4.1 percent of the population, or 3,415,612 people, have had their second dose.
Like most other European countries, the vaccination rollout in Germany has been hampered by the European Union’s collective buying programme, as well as issues with the AstraZeneca vaccine. The recent drop in March coincides with the now-reversed decision to suspend the use of Oxford-Swedish vaccine amid side-effects concerns.
READ ALSO: Why have tens of thousands of Germany's AstraZeneca vaccines not been used?
The chart below shows the rolling seven-day average of the number of vaccination doses administered in Germany since the vaccination programme started in December 2020.
How strict has Germany been?
The chart below gives an idea of how strict the German government has been in introducing measures to stem the spread of the virus.
It shows how the governmental response has changed over time and also indicates a measure called the Government Stringency Index. This is a composite measure of the strictness of policy responses.
On any given day, this index is calculated as the mean score of nine policy measures, each taking a value between 0 and 100, where 100 is the strictest.
The nine metrics used to calculate the Government Stringency Index are: school closures, workplace closures, cancellation of public events, restrictions on public gatherings, closures of public transport, stay-at-home requirements, public information campaigns, restrictions on internal movements, and international travel controls.
In the below chart you can see the German government reaction compared to that of neighbours France, Austria and Switzerland.
What’s the situation in hospitals?
According to DIVI, Germany’s intensive care availability register, the number of Covid-19 patients needing intensive care currently stands at 3,209, a day-on-day increase of 38. A full 54 percent of these patients are on invasive mechanical ventilation.
This is up from 2,736 patients from two weeks earlier (March 10th), signalling that pressure is increasing on German hospitals.
As of March 24th, a total of 20,713 intensive care beds (low- and high-care) are occupied and 3,411 beds are currently available.
READ ALSO: 'Chronic overwork of staff': Germany sees spike in Covid-19 intensive care patients
The below graph from the RKI shows how the number of Covid-19 patients being treated in intensive care has changed since the start of the pandemic.
And this table from DPA (below) shows the number of patients in intensive care per state, each state's percentage of Germany's total intensive care patients and how full each state's ICU's are. As you can see, intensive care units in Thuringia are at 85 percent of their total capacity.
To view more charts, maps and graphs on Germany’s Covid-19 situation, you can visit Our World in Data.
Join the conversation in our comments section below. Share your own views and experience and if you have a question or suggestion for our journalists then email us at [email protected].
Please keep comments civil, constructive and on topic – and make sure to read our terms of use before getting involved.
Please log in here to leave a comment.